
Analytics
Analytics gives you a cross-agent view of your AI coding activity. Every session you sync — from Claude Code, Codex CLI, Antigravity CLI, Cursor, and more — feeds a single dashboard where you can see how much you code with AI, when you do it, how deep your conversations go, and what it's costing you.
Open it from the navigation at cloud.specstory.com/analytics.
How it works
- Data source: your synced sessions. If a project isn't synced, it won't appear in Analytics.
- Time range: every view is scoped to a window you pick in the top-right — 7, 30, or 90 days. The range carries across tabs and is preserved in the URL, so links you share open on the same window.
- Processing status: newly synced sessions are processed in the background. A status pill in the header shows when Analytics is still catching up; numbers refresh automatically once processing finishes.
- Filters: many charts are clickable. Selecting an agent or project filters every tab until you clear the filter chip at the top of the page.
The dashboard is organized into four tabs: Overview, Activity, Messages, and Ledger.
Overview
The Overview tab is your at-a-glance summary. Almost every panel is a click-through into one of the other tabs.
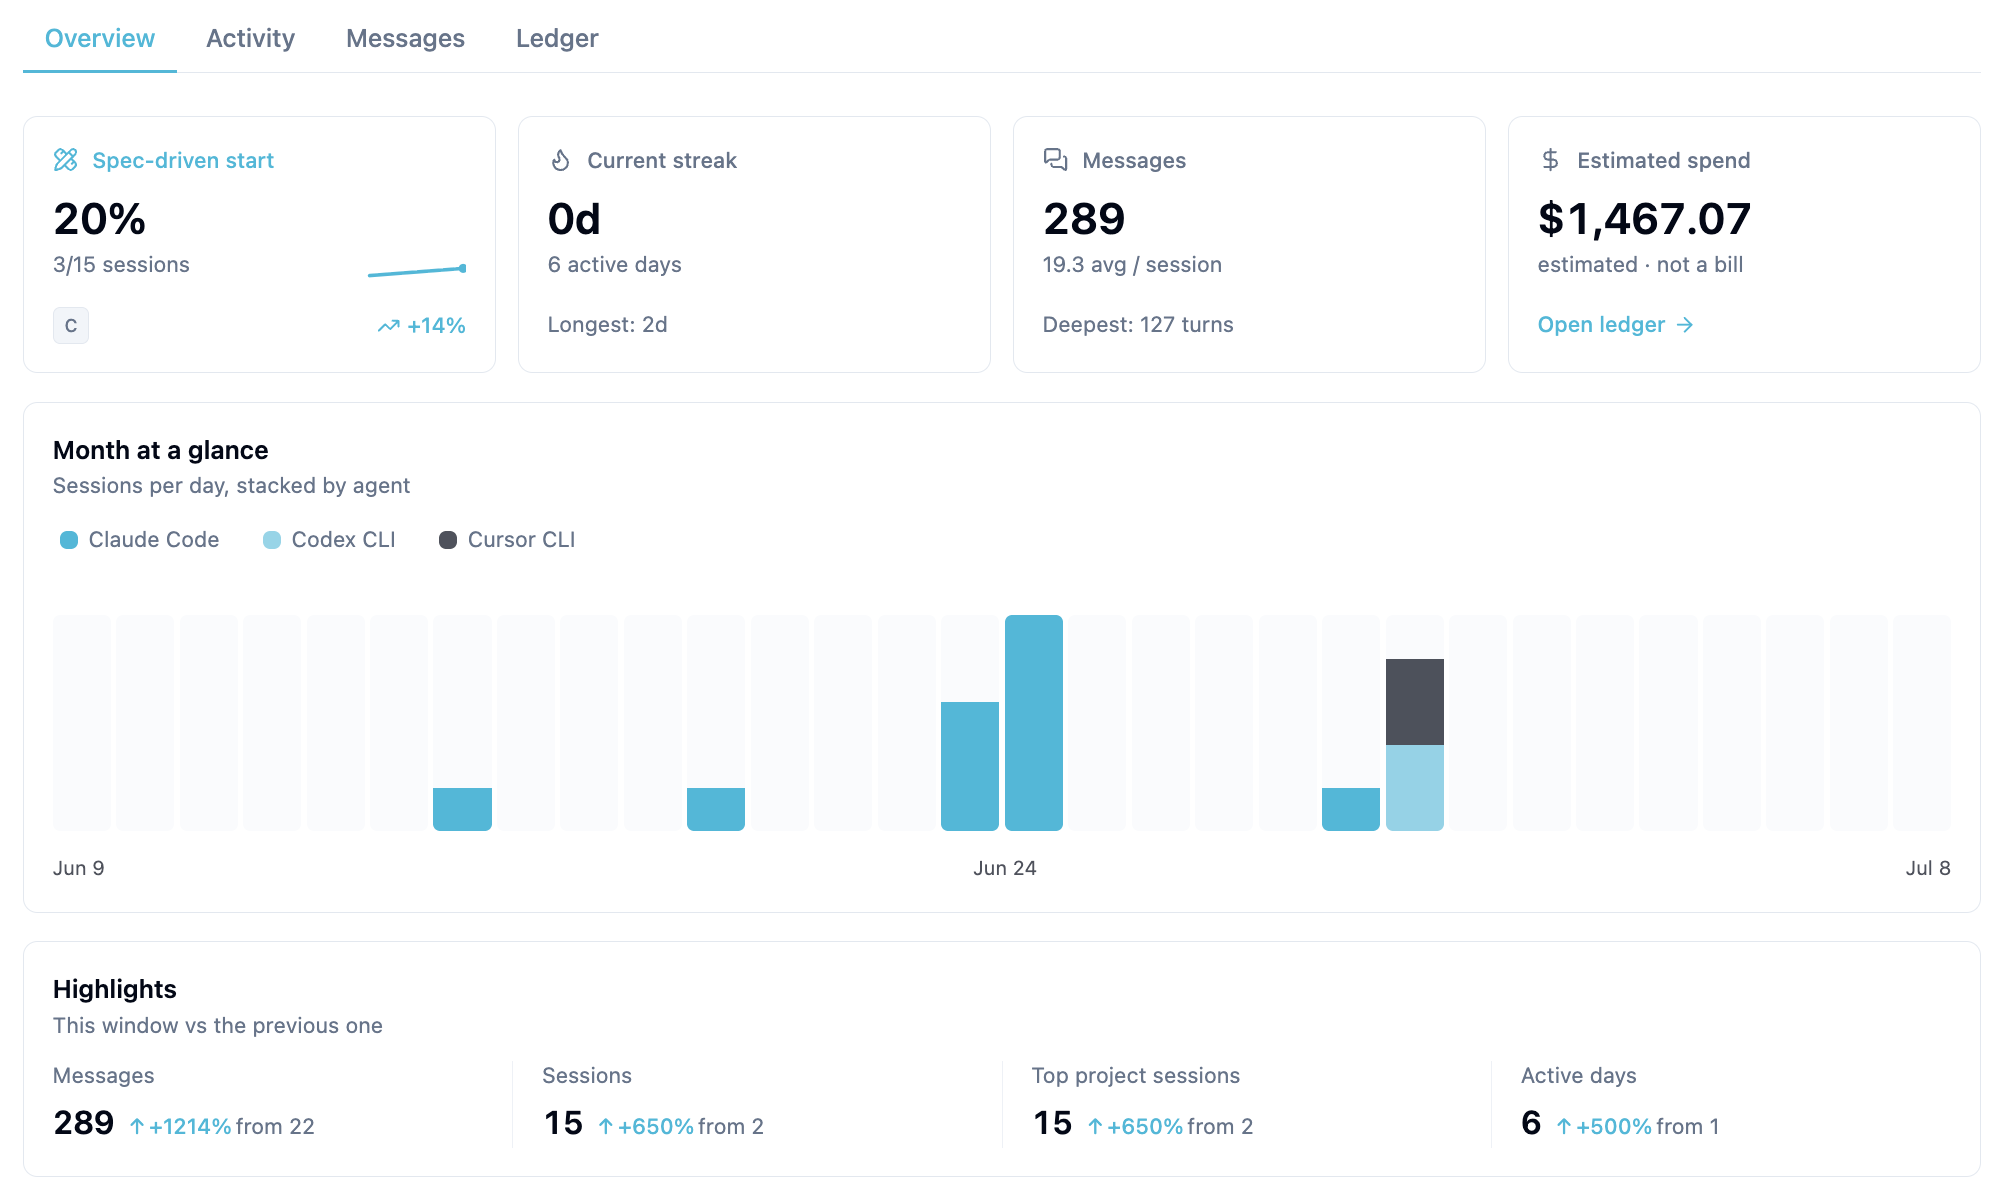
- Spec-driven start: the percentage of sessions that began with a well-specified opening prompt, with a letter grade and a trend versus the previous window. This is powered by Spec Score, which grades the first prompt of each session.
- Current streak: consecutive active days, plus your longest streak and total active days.
- Messages: total user↔agent exchanges in the window and the average per session.
- Estimated spend: your estimated token cost for the window — click through to the Ledger for the full breakdown.
- Month at a glance: sessions per day, stacked by agent. Click an agent in the legend or a day in the chart to drill into the Activity tab.
- Highlights: how this window compares to the previous one (sessions, messages, and more).
- When you code: an hour × weekday punchcard, in your local timezone, with your peak coding window called out.
- Top projects: your most active projects by session volume — click one to see its sessions.
- Coverage: exactly what is and isn't counted, including sessions with missing timestamps or no messages.
Activity
The Activity tab is about volume and rhythm: how much you're coding with AI, and when.
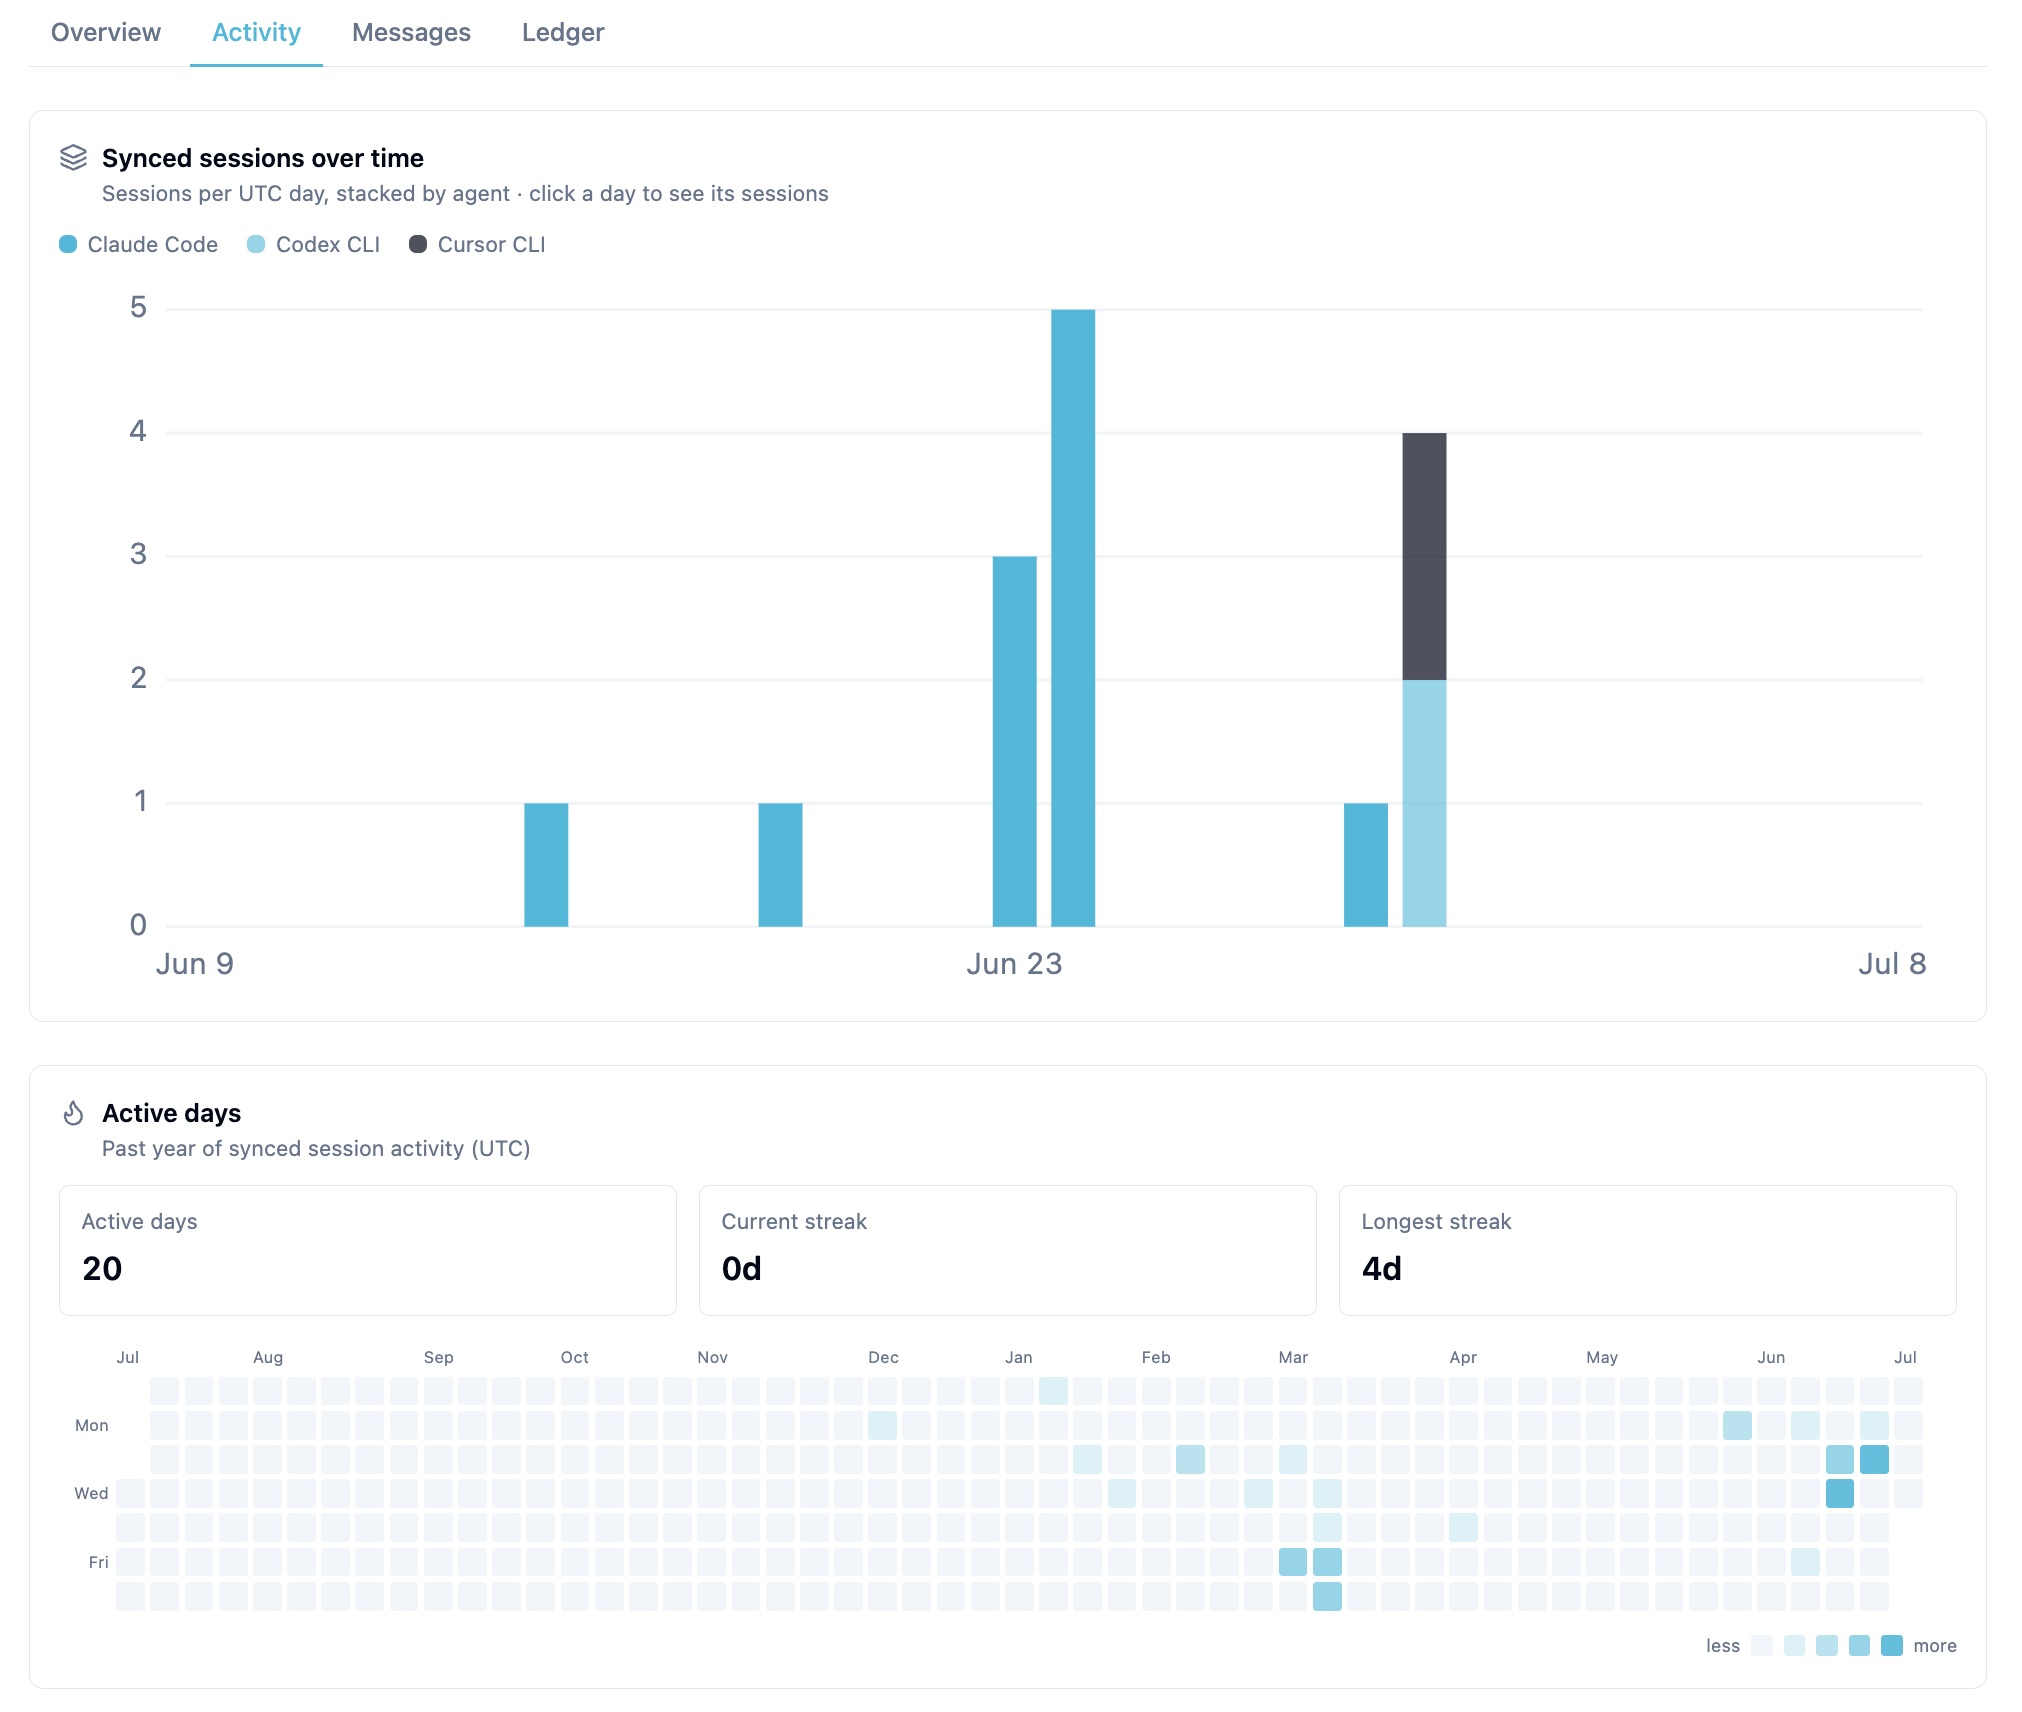
- Synced sessions over time: sessions per day, stacked by agent. Click any day to open a list of that day's sessions, and click a session to open it.
- Active days: a GitHub-style calendar heatmap of your past year of activity, with active-day count, current streak, and longest streak. This always shows the trailing 365 days, independent of the selected range.
- Time of day: your coding rhythm by hour and weekday, with drill-downs into specific time slices.
- Peak concurrency: the most sessions you had running at once.
- Active duration by agent: median session length per agent (with p90), so you can see which agents you tend to run in long sessions versus quick hits.
Messages
The Messages tab looks inside your sessions: how many turns your conversations take and how they're distributed.
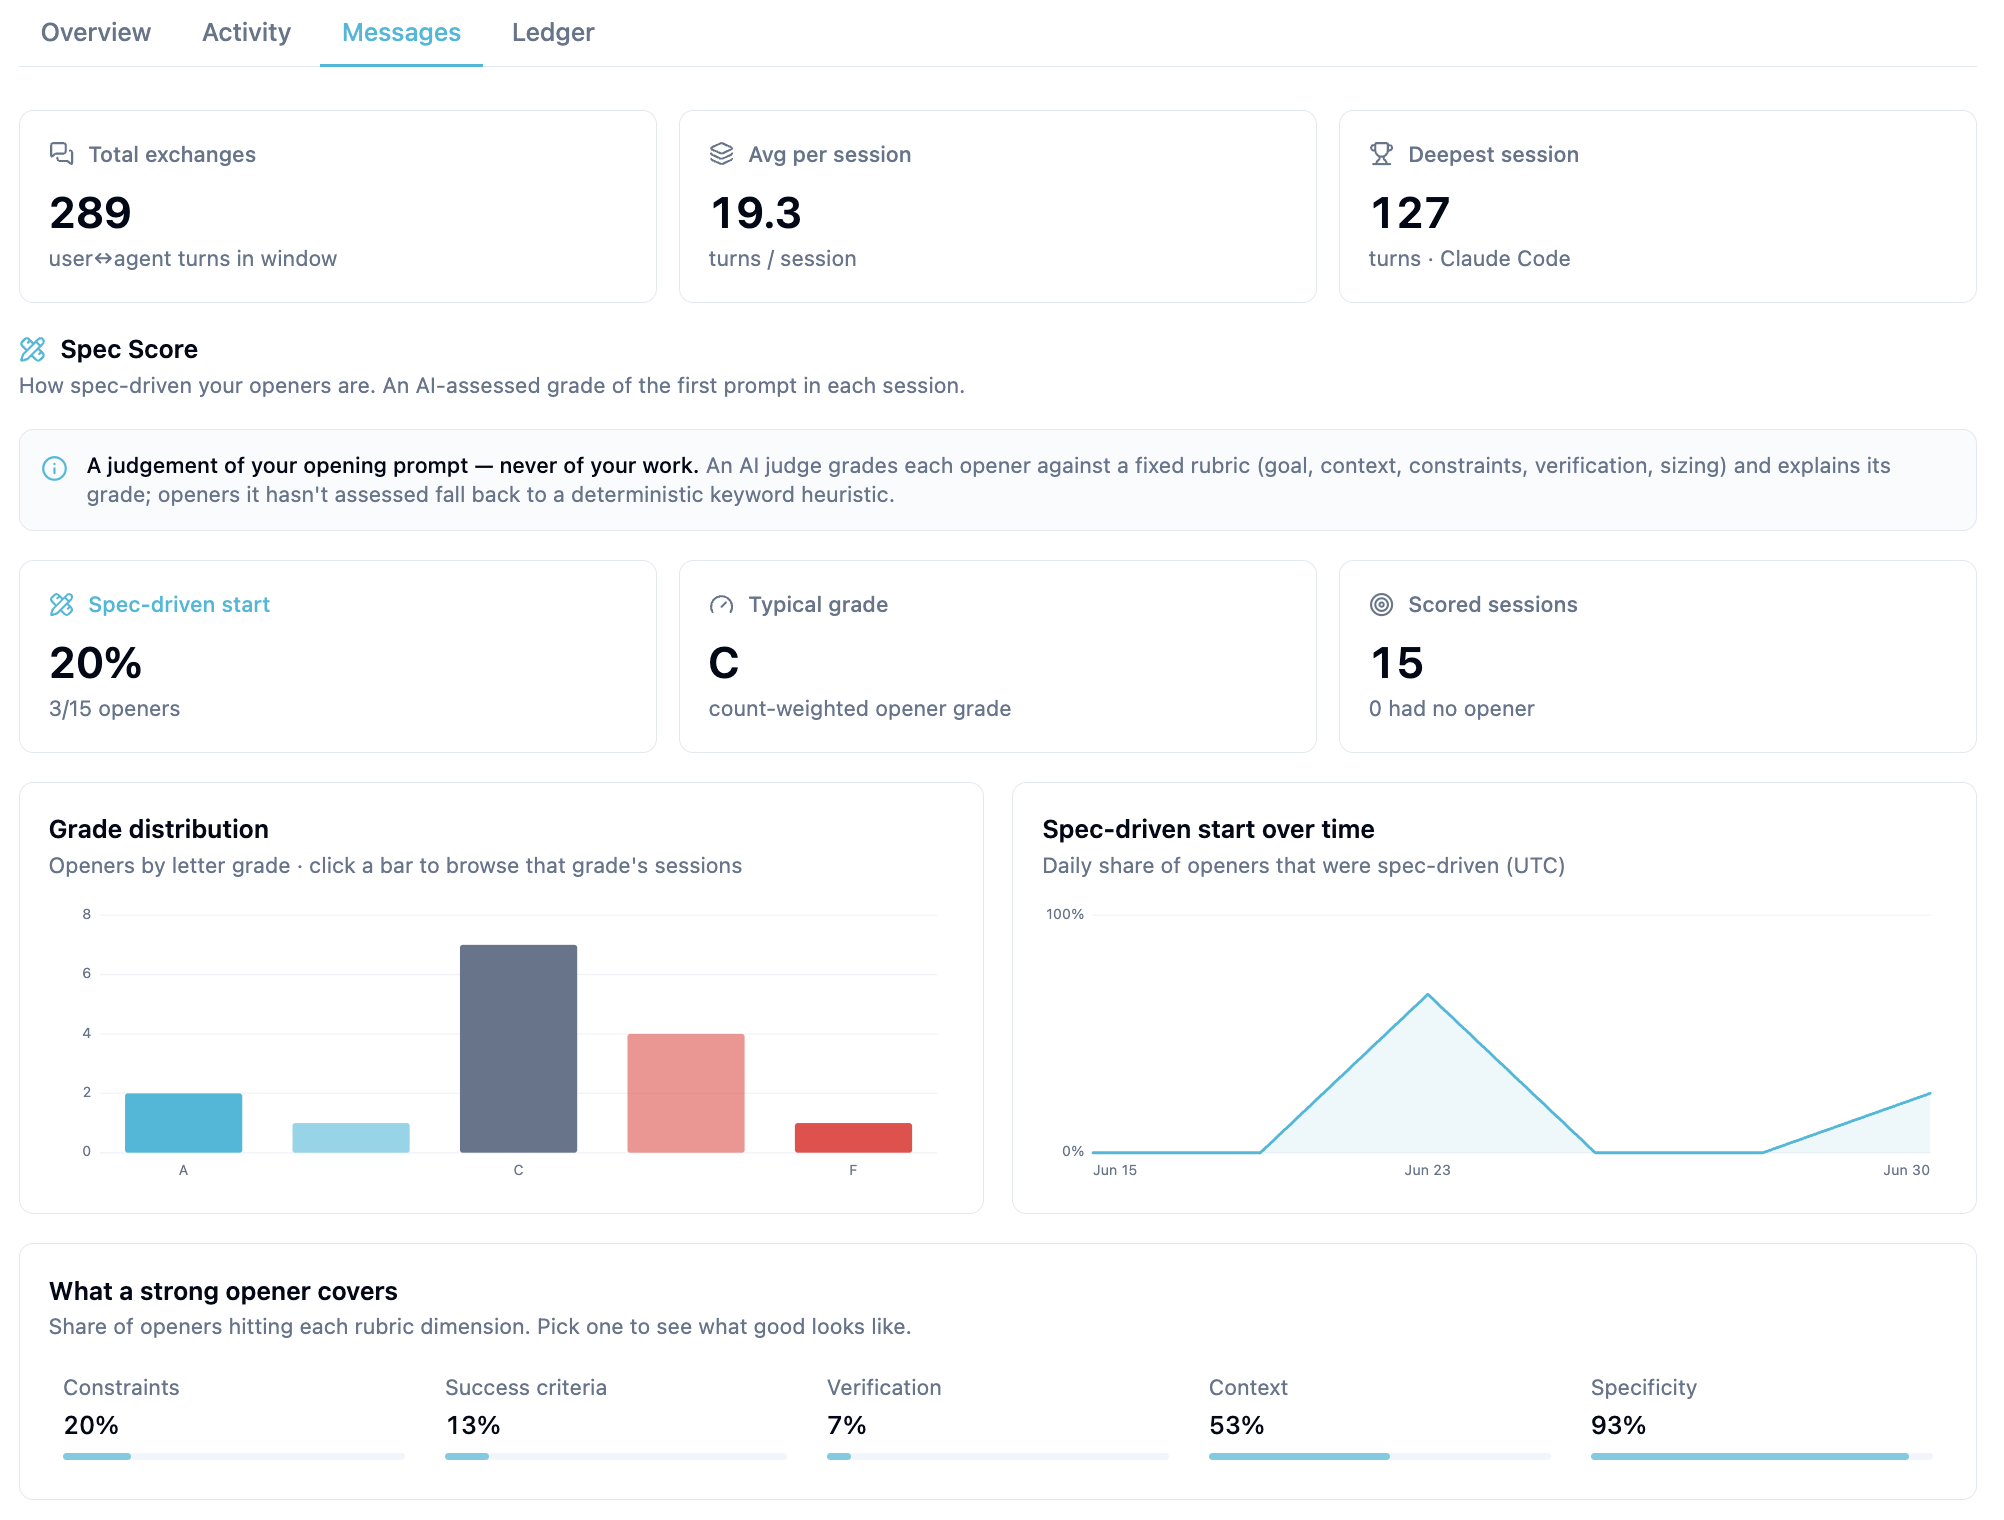
- Headline stats: total exchanges, average turns per session, and your deepest session in the window.
- Spec Score: a detailed look at opening-prompt quality, including the grade distribution across your sessions.
- Conversation depth: sessions bucketed by turn count — from one-shot prompts to marathon conversations. Click a bucket to list the sessions in it.
- Turns by agent: which agents you exchange the most messages with.
- Longest conversation: the single deepest session in the window, one click away.
Ledger
The Ledger tab estimates what your AI coding sessions cost, computed from per-message token usage at published list prices.
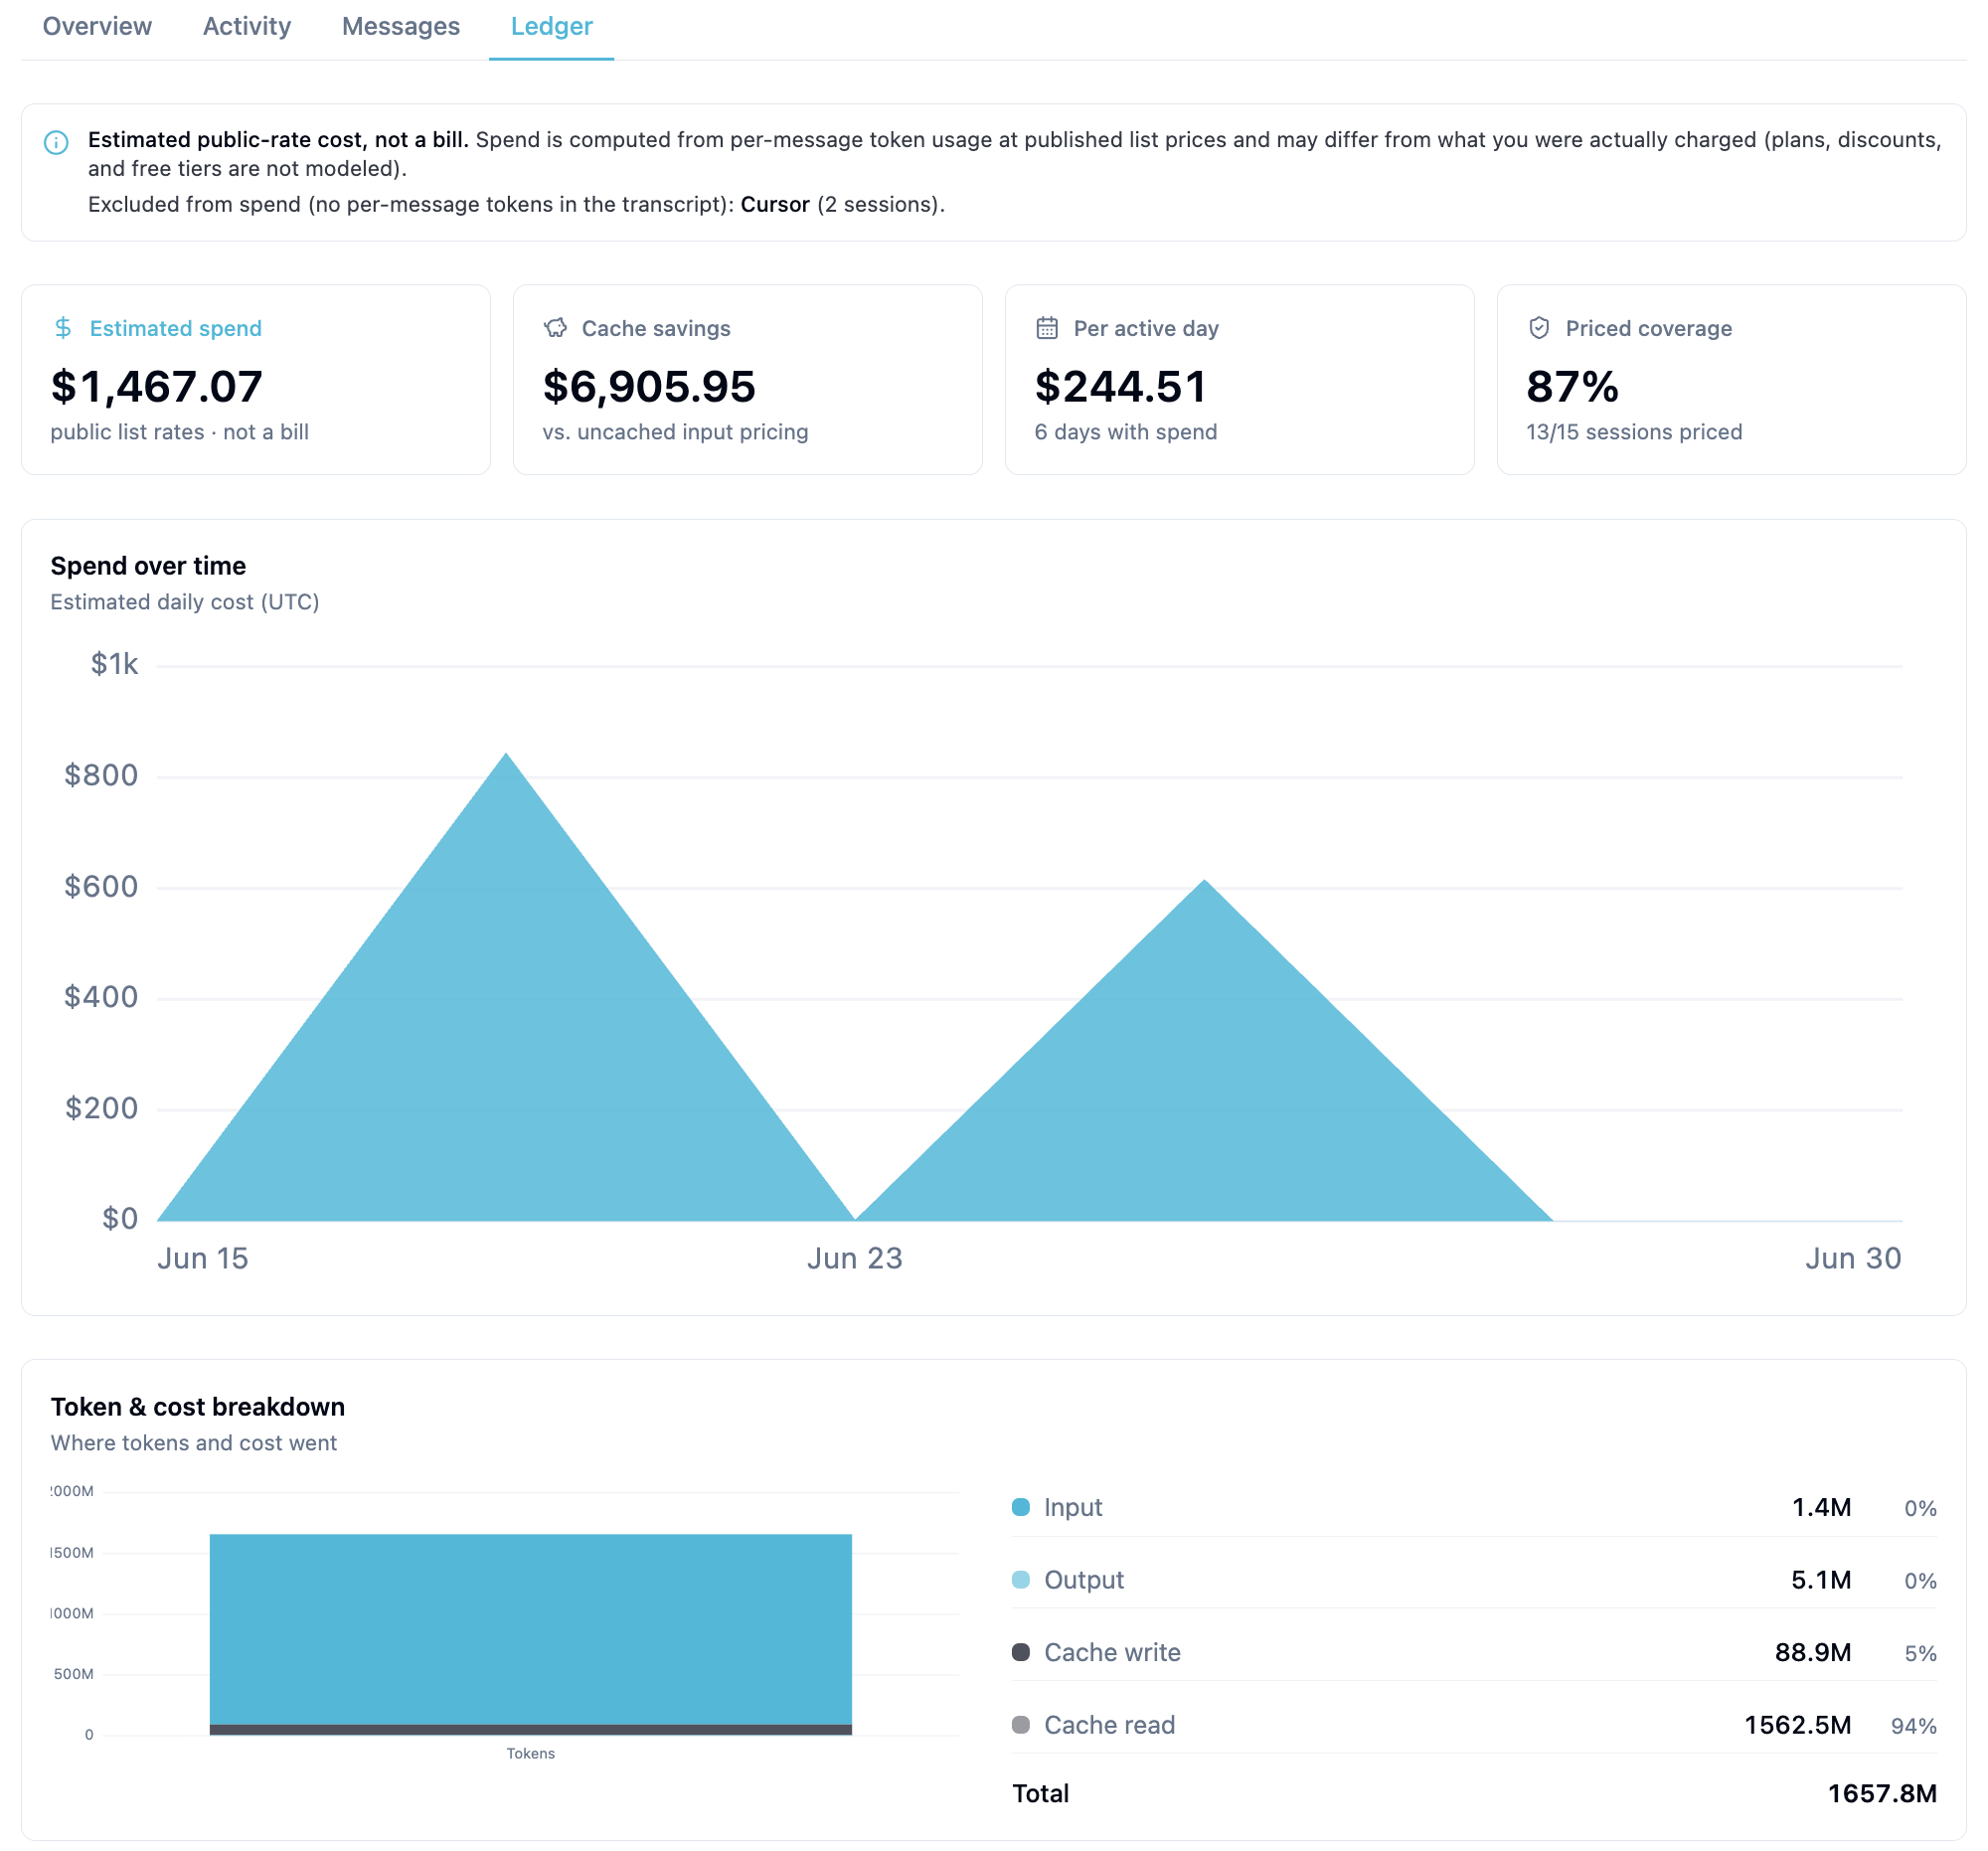
- Estimated spend: the headline total for the window, plus spend per active day.
- Cache savings: what prompt caching saved you compared to uncached input pricing.
- Priced coverage: how many of your sessions carry token data and contribute to the estimate.
- Spend over time: estimated daily cost across the window.
- Token & cost breakdown: input, output, cache-write, and cache-read tokens, and how each contributes.
- Spend by agent and by project: where the money goes — click a bar to see the underlying sessions.
- Cache efficiency: your cached-token share and read/write split.
Coverage
Every tab includes explicit coverage notes so you always know what's behind a number:
- Sessions with no messages, or with missing timestamps, are called out rather than silently dropped.
- Duration and concurrency stats list exactly how many sessions were eligible.
- The Ledger separates "sessions we could price" from "sessions we counted but couldn't price."
If a number looks lower than you expect, check the Coverage panel on that tab first — the most common cause is sessions that haven't been synced yet.